Workflow
The Workflow settings category contains system-wide configuration for the B2Win Suite workflow execution engine. These settings affect all workflows across the system and should only be changed by administrators who understand the performance implications.
Settings
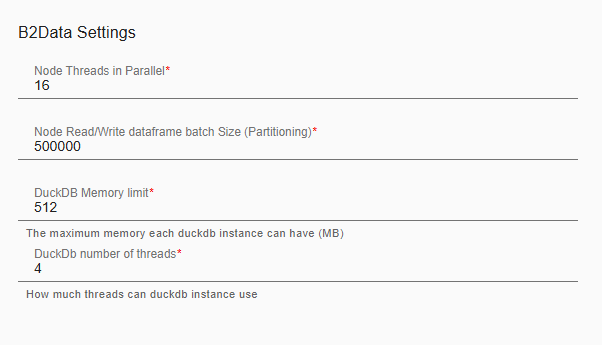
Node Threads in Parallel
The number of threads used for node execution across all workflows on this server. Increasing this value can improve throughput when running many concurrent iterations, but increases CPU and memory consumption. Set this in relation to the number of CPU cores on the server.
Node Read/Write DataFrame Batch Size (Partitioning)
The number of rows processed in each read/write batch for DataFrame operations. Larger values improve throughput but use more memory per iteration. Lower values reduce memory pressure but increase the number of I/O operations.
DuckDB Memory Limit (MB)
The maximum memory in megabytes that each DuckDB instance can use. DuckDB is the in-memory SQL engine used by Query In-Memory and similar nodes. If queries are failing with out-of-memory errors, increase this value. On systems with limited RAM, reducing this value protects other processes.
DuckDB Number of Threads
How many CPU threads each DuckDB instance can use for query processing. More threads can speed up complex aggregations and joins on large DataFrames.
Alerts
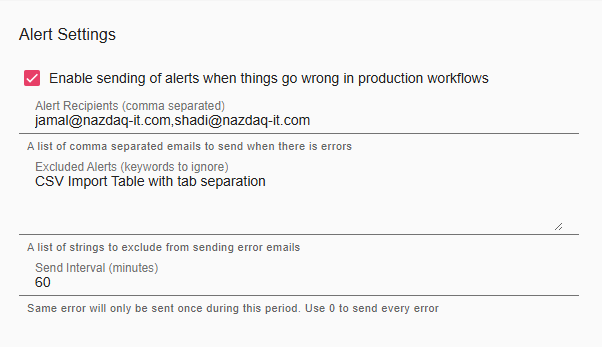
Email alerts sent when production workflows fail. See the full reference in the Alerts documentation.
| Setting | Description |
|---|---|
| Enable alerts | Master toggle for alert email sending |
| Alert Recipients | Comma-separated email addresses that receive alert notifications |
| Excluded Alerts | Strings (one per line) — alerts containing these strings are suppressed |
| Send Interval (minutes) | How long to wait before sending the same error again. Use 0 to send every occurrence. |
Compiler
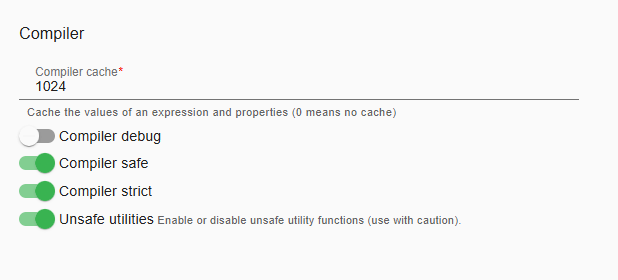
Settings for the JEXL scripting expression compiler used throughout workflows.
| Setting | Description |
|---|---|
| Compiler cache | Number of compiled expressions to cache. Caching speeds up re-evaluation of the same expression. Set to 0 to disable caching. |
| Compiler debug | Provides more detailed log output for debugging expression evaluation. Only enable temporarily during troubleshooting. |
| Compiler safe | Enforces safety checks — prevents expressions from accessing classes or methods that are not whitelisted. Recommended to keep enabled in production. |
| Compiler strict | Applies stricter validation during compilation. Expressions that would produce null-pointer-like errors at runtime fail at compile time instead. |
| Unsafe utilities | Enables access to unsafe utility functions in expressions. Only enable if you understand the security implications. |
Storage
The workflow engine uses RocksDB as its internal storage engine for persisting iteration data, node outputs, trigger states, and other execution metadata. These settings control how RocksDB allocates memory and manages its internal files.
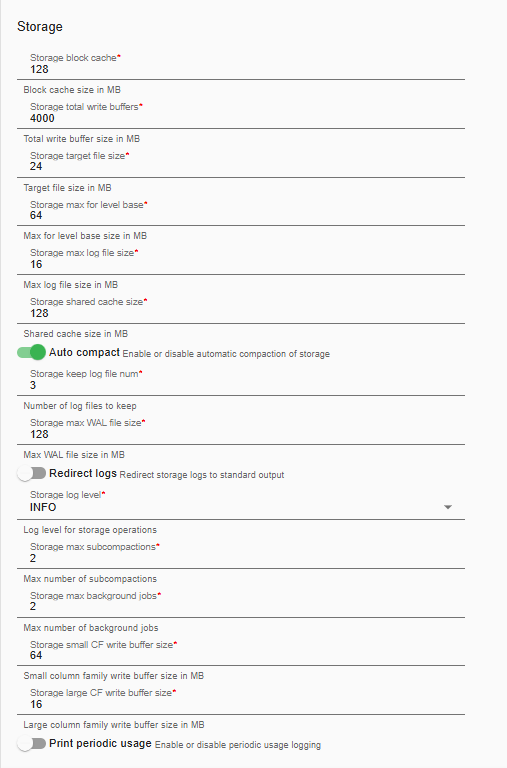
These are low-level tuning parameters for the embedded storage engine. In most deployments, the default values work well. Only change these settings if you are experiencing specific storage performance issues.
| Setting | Default | Description |
|---|---|---|
| Storage block cache (MB) | — | The size of RocksDB's read block cache in MB. Larger caches improve read performance for frequently accessed data. |
| Storage total write buffers (MB) | — | Total memory budget for all write buffers across all column families. Increase for write-heavy workloads. |
| Storage target file size (MB) | — | Target size for SST files created during compaction. |
| Storage max for level base (MB) | — | Maximum total data size for level 1 in leveled compaction. |
| Storage max log file size (MB) | — | Maximum size for individual write-ahead log (WAL) files. |
| Storage shared cache size (MB) | — | Size of the shared block cache used across all RocksDB column families. |
| Auto compact | Enabled | When enabled, compaction runs automatically in the background to reclaim disk space and optimize read performance. |
| Storage keep log file num | — | Number of old WAL files to retain. Older files beyond this count are deleted. |
| Storage max WAL file size (MB) | — | Maximum total size of all WAL files. |
| Redirect logs | Disabled | Redirects RocksDB internal log output to the standard application log (application.log). |
| Storage log level | — | Verbosity of RocksDB's internal logging. Options: DEBUG, INFO, WARN, ERROR, FATAL. |
| Storage max subcompactions | — | Maximum number of subcompaction threads. More threads can speed up large compaction jobs. |
| Storage max background jobs | — | Maximum number of background threads for compaction and flush operations. |
| Storage small CF write buffer size (MB) | — | Write buffer size for small column families. |
| Storage large CF write buffer size (MB) | — | Write buffer size for large column families (used for iteration data). |
| Print periodic usage | Disabled | Logs RocksDB memory and disk usage statistics periodically to the application log. Useful for monitoring storage health. |
Monitoring Storage Health
To check current disk usage per workflow, use the Disk Usage view in the Workflow Manager. For system-wide storage monitoring, enable Print periodic usage and check application.log.