Home (Dashboard)
To open the Home page, click Home on the left navigation panel. The page is split into two tabs: B2Data and B2Output.
B2Data Tab
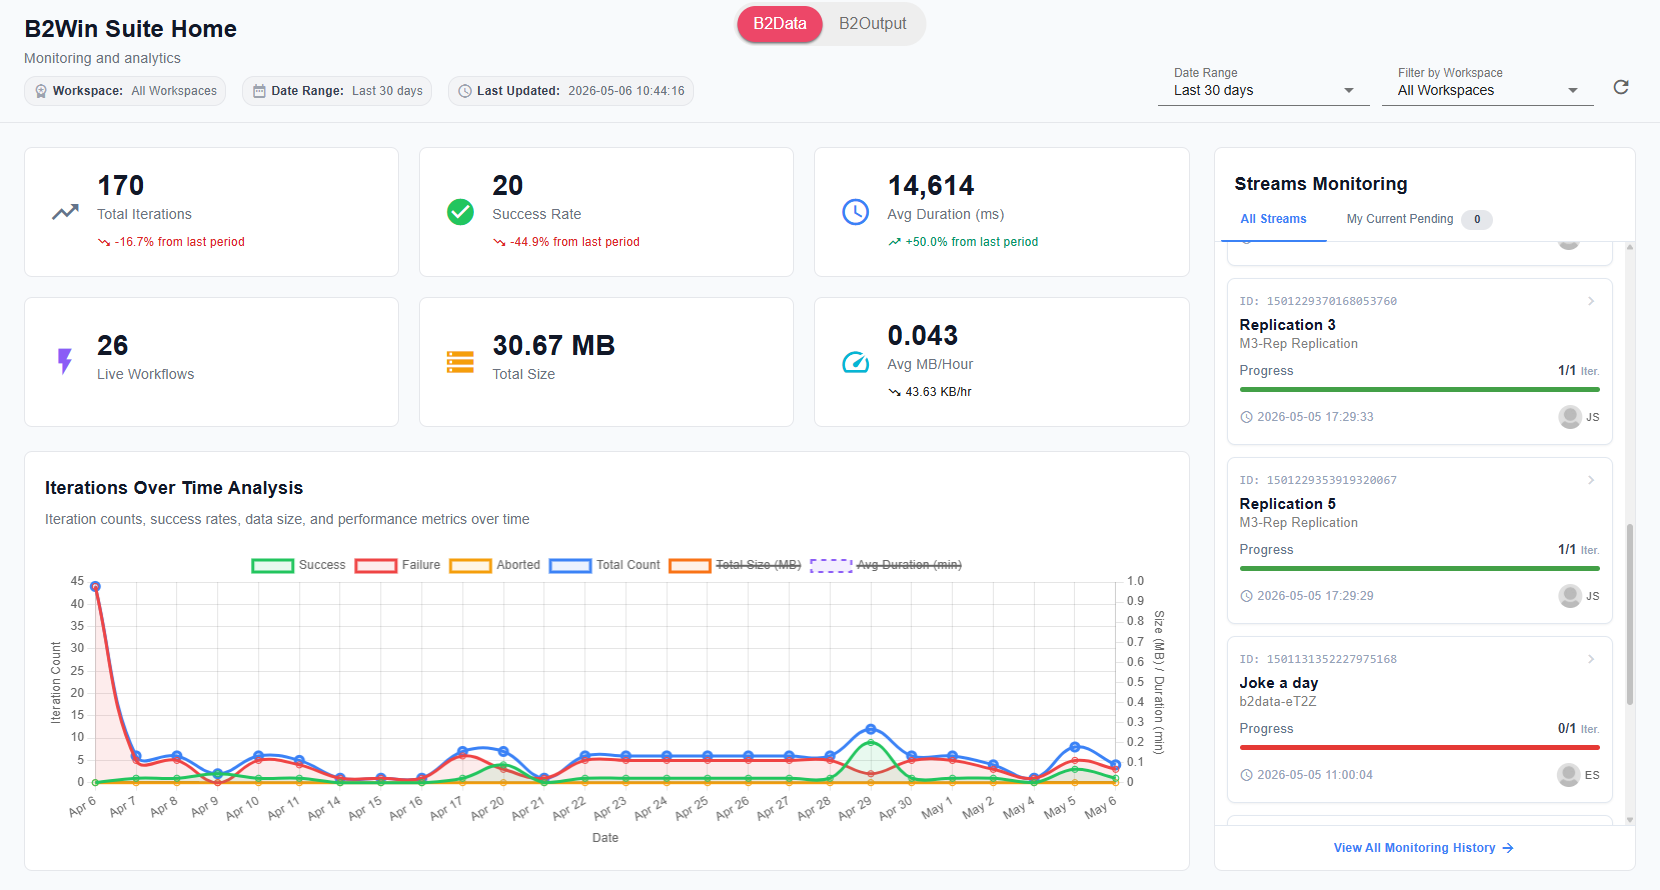
The B2Data tab shows workflow execution analytics and live stream monitoring. It provides monitoring and analytics for your workflows. At the top you can control the Date Range and filter by Workspace.
KPI Cards
Six summary cards are displayed at the top:
- Total Iterations — the total number of workflow iterations executed in the selected period, with a percentage change compared to the previous period.
- Success Rate — the percentage of iterations that completed successfully.
- Avg Duration (ms) — the average execution time per iteration in milliseconds.
- Live Workflows — the number of workflows currently deployed and running.
- Total Size — the total data size processed across all iterations.
- Avg MB/Hour — the average data throughput rate.
Iterations Over Time Analysis
A multi-line chart showing iteration counts, success rates, data size, and performance metrics over the selected date range. The chart legend includes:
- Success — iterations that completed successfully.
- Failure — iterations that failed.
- Aborted — iterations that were stopped before completion.
- Total Count — the total number of iterations per day.
- Total Size (MB) — total data size per day (secondary axis).
- Avg Duration (min) — average execution duration per day (secondary axis).
Streams Monitoring
A panel on the right side showing active workflow streams. It has two views:
- All Streams — lists all running streams with their ID, name, workspace, progress (iterations completed), and last run time.
- My Current Pending — shows streams pending for the current user.
Click View All Monitoring History at the bottom of the panel to open the full monitoring log.
Latest Iterations
A table providing a real-time overview of recent iterations, with columns for Workflow ID, Workflow, Iteration ID, Timestamp, Run By, and Status.
Live Workflows
A table listing all currently running workflow executions, showing the Execution ID, Workspace, Name, Progress, and Completed/Total count.
Top Workflows by Usage & Size
A stacked bar chart showing usage count and scaled total size per workflow, making it easy to identify the most active or data-heavy workflows.
Workflow Size Analysis
A table with detailed size metrics per workflow, including Workflow name, Usage, Total Size, and Avg Iteration Size.
Execution Duration Analysis
Performance metrics for workflow execution times. For each workflow it shows the minimum, maximum, and range of execution durations, along with a bar indicating the median duration.
Trigger Type Distribution
A donut chart showing how workflows are being triggered, broken down by trigger type (e.g., Scheduler, InfoSuite/Table, Manual).
B2Output Tab
For B2Output activity — report conversions, statistics, and charts — see the B2Output Dashboard.