This article offers a time-saving solution to the common challenge of taking canned reports into Excel for producing periodic financial statements, namely, the trial balance. In the article, we refer to a fictitious vehicle manufacturing company to give an example of a possible use-case.
Case
The new CFO of a vehicle manufacturing company discovered that their periodic financial statements are usually late and take a few weeks to be generated. Even when the reports finally arrive, they do not reflect the company’s current situation but that of 3-4 weeks earlier. In a fast and dynamic age like ours, this isn’t sufficient. The company’s executives do not know which business units are making a profit, which business units are losing, and where the expenses are. The CFO realized that the situation must change as her team needs data faster for the company to make data-based decisions more quickly. This is how modern businesses operate; there is a need for timely data.
Obstacle #1 : Data Extraction Hassle
In her pursuit to make this process faster, the new CFO did her research and found out that extracting and collecting data for the trial balance data is a lengthy process that includes a lot of manual work.
There are a few trial balance reports that are needed:
- Trial Balance (Ledger account/Dimension)
- Trial balance (Dimension/Ledger account)
- Trial Balance (Print Sequence/Ledger Account)
Obstacle #2: Not “Excel Ready”
After extracting and collecting data, you find that the trial balance report is not “Excel ready.” Even if you take it into an ASCII file and then read it using the Excel wizard, you still find that
- Data that needs to be in one row is spread throughout multiple lines.
- Some header information needs to be converted into additional columns.
- There is no need for all the totals and subtotals as they will be calculated by Excel nevertheless.
- Certain columns need to be split.
- Some columns need to be rearranged.
- For formatting purposes, in good Baan/Ln fashion, the minus sign is on the right. This does not automatically convert to a negative number in Excel.
- Some adjustments to data types need to be made. This is because Excel tries to “guess” data types based on the first few lines, but some columns can be numbers first and then alphanumeric.
Obstacle #3: Repetitive work
Although Excel provides some tools to do part of the challenging steps above, they have to be done manually each time the report is generated, and some of those steps are pretty complicated and time-consuming.
The CFO asked for a tool that can automate this process to avoid this monthly repetitive work.
Solution
While searching for a solution, the company’s teams found B2Win Suite with its amazing Excel Designer and decided to use them to automate the transfer of the monthly trial balance to Excel. Through this easy-to-use tool, they could design their reports by organizing how data is distributed, which data is included, and even add new calculated fields through which data is demonstrated- a feature that broadens the perspectives of analysts and the potential of data usage.
How it works: initially, it takes three steps; from then on, it takes ONE-CLICK.
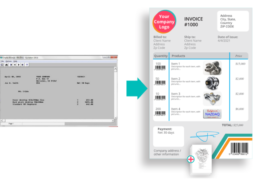
Print to B2Win Suite: print your ERP report to B2Win Suite (printer device) and open it with Excel Designer.
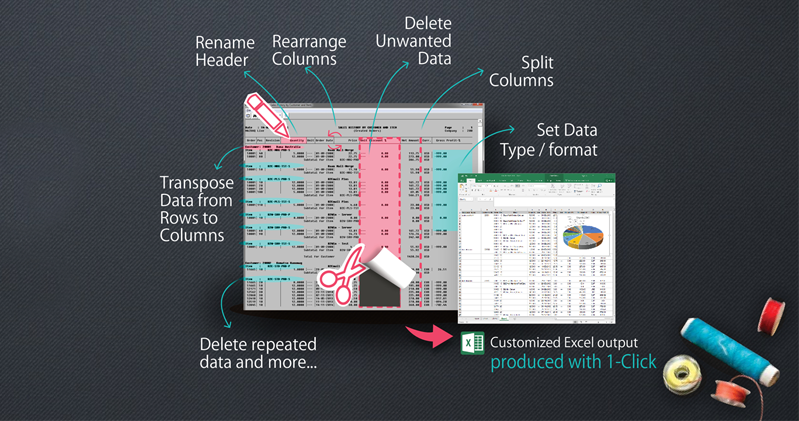
Map your data: most of the columns are identified automatically; you just need to choose which data to keep, remove, or transpose from rows to columns in the report.
Design and Preview: finalize your report with easy-to-use design tools. See your design come together as you work and save it for future repetitive use with one click.
Now, every month, with a press of a button, the trial balance report goes to Excel in its predesigned and desired form and allows the finance department to work on the report quickly.
Before

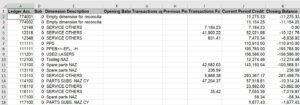
After
Excel Designer’s Key Features
- Handle Floating text in the report and make sense of it. It can be kept, deleted (like we do with subtotals, for example), or Pivoted (down, up, a single time, or repeated)
- Handle multiple line reports
- Split columns based on location or character
- Force a certain data type (alphanumeric fields with leading zeros are a classic example)
- Rearrange the columns of the original report in a way that fits you better
- Hide or remove certain fields
- Add calculated fields based on other fields
- Add database fields based on other fields
- Set and rename headers
Why it’s easy to use:
- Friendly graphical user interface
- Powerful report transformation capabilities
- Macro integration
To see how user-friendly the Excel Designer is, have a look at how we easy it is to prepare a report that has sub-headers, sub-totals, and columns that need to be split.
Looking at the bigger picture, the vehicle manufacturing company now obtains a tool whose role extends beyond design and data preparation. By making complex and vital processes like data extraction and analysis faster and more efficient, B2Win allows the company to make critical decisions based on reliable and quick data conclusions that steer the company’s wheels in the most optimal direction.
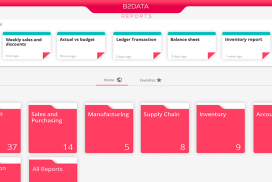
To see NAZDAQ’s product for taking your trial balance from Infor LN/Baan into Excel in one click, please visit B2Data – B2Win Suite